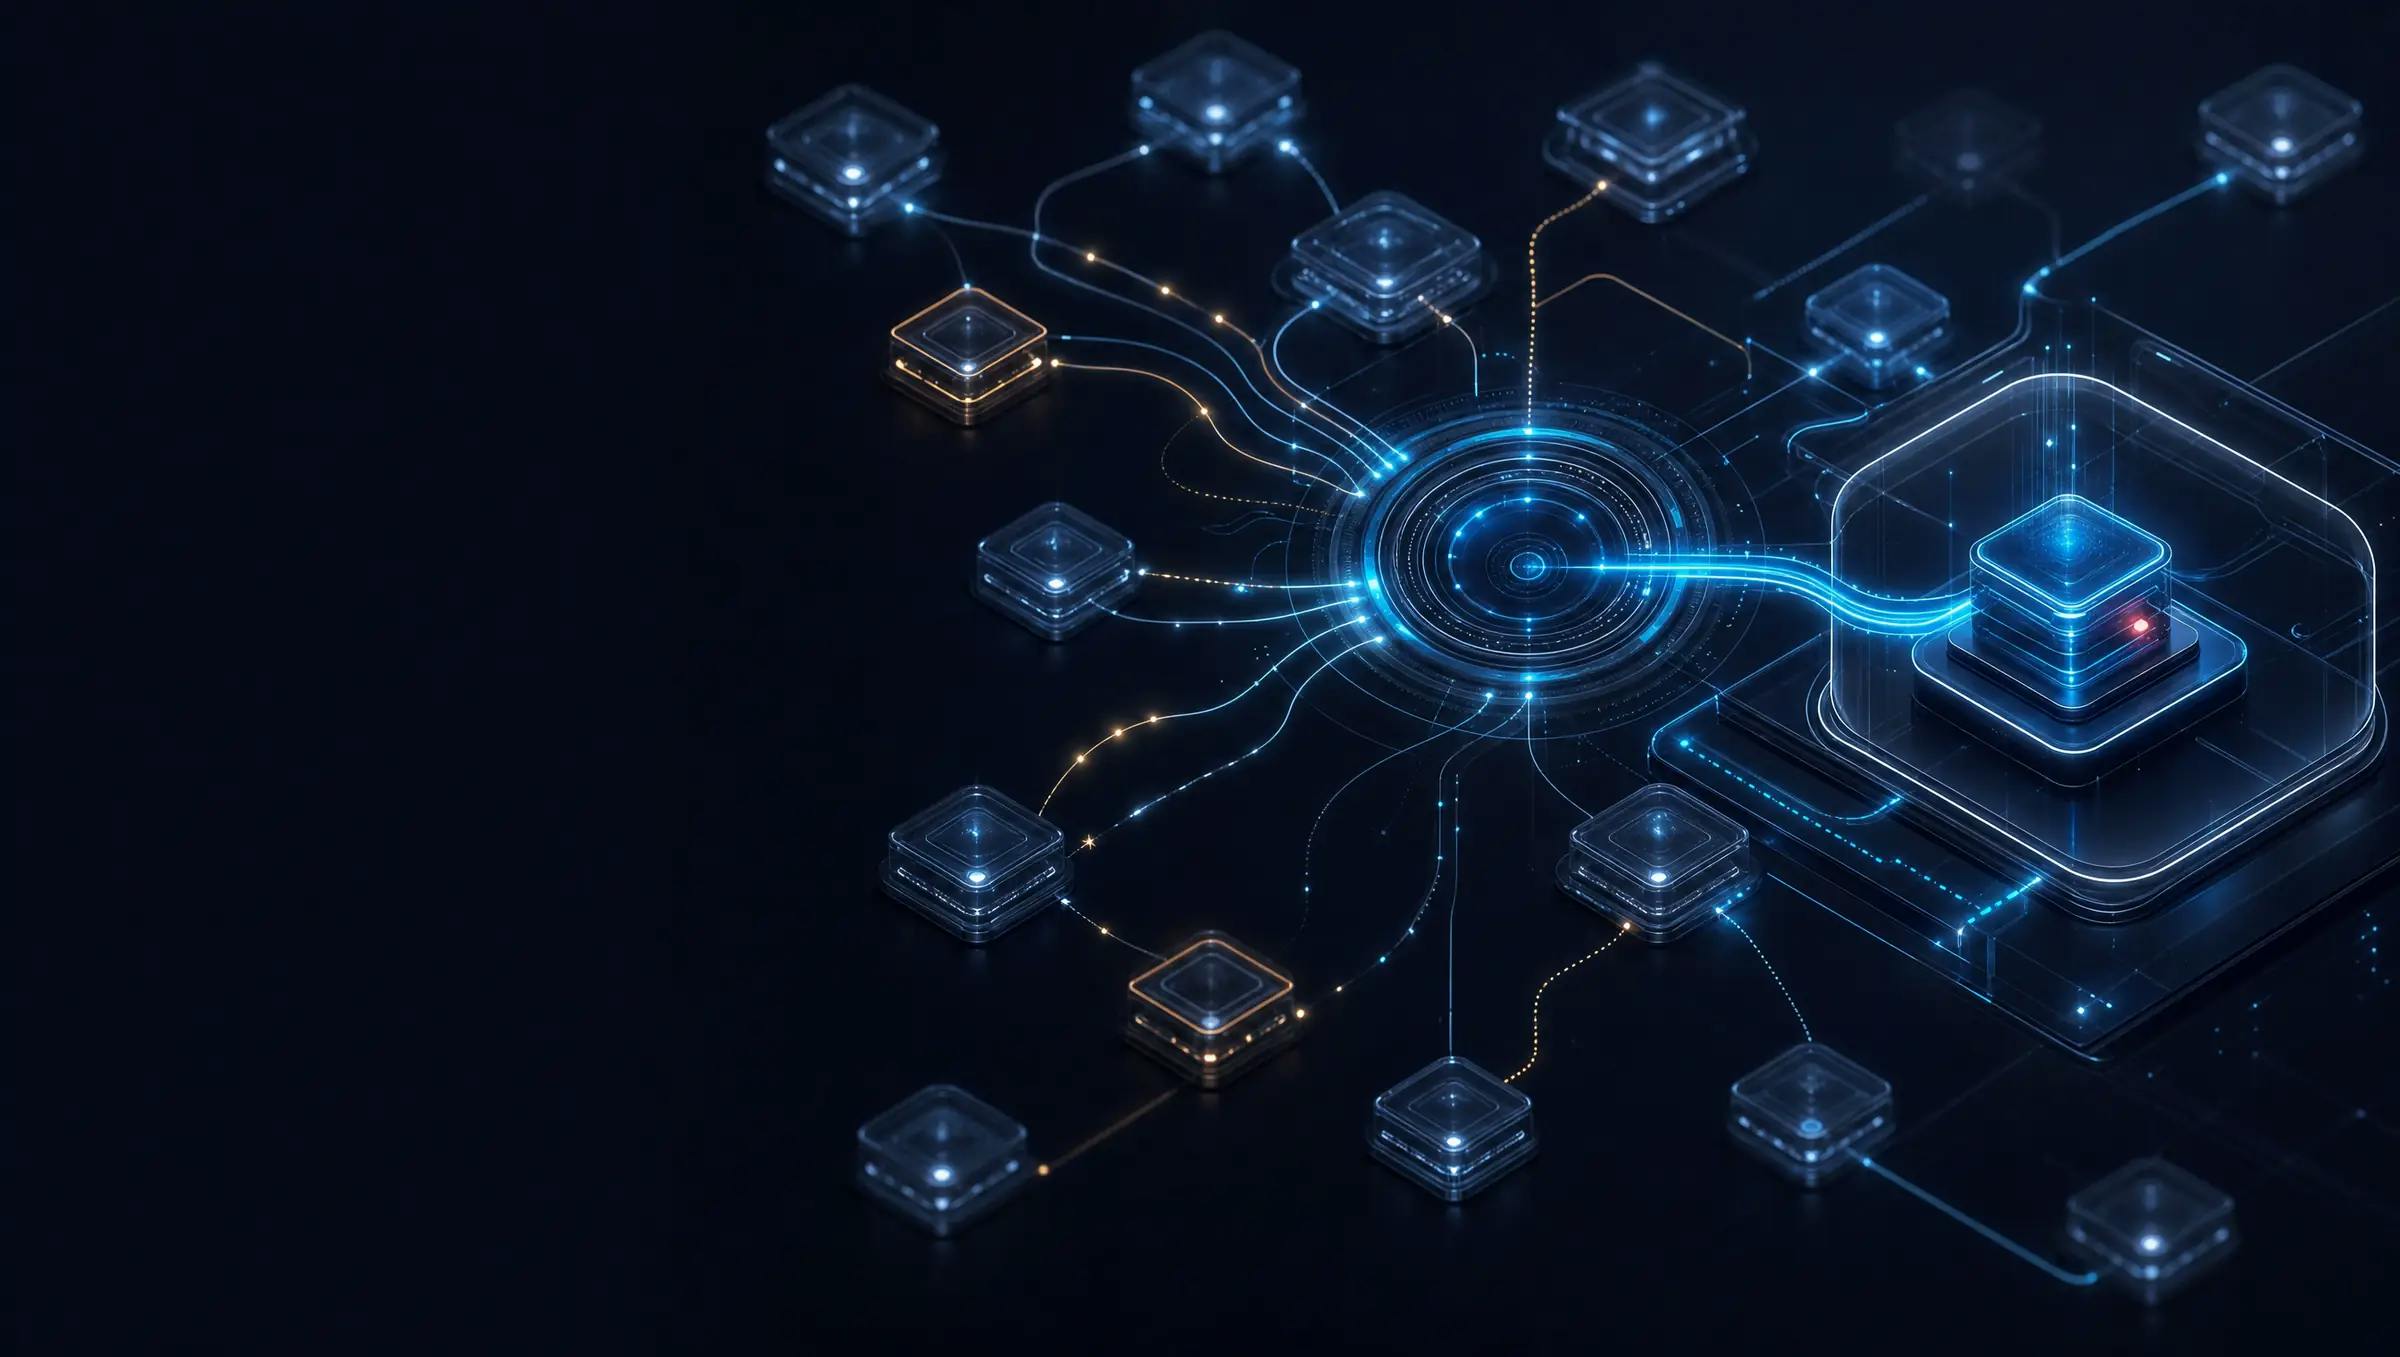
Collection Layer
iCollector
Gathers telemetry from every client environment and add-on and normalizes it into the shared context-aware data model, preparing the signal every layer above it depends on.
Platform · How it works
The platform governs the full lifecycle from the moment an event is collected to the moment a threat is contained.
The lifecycle
The platform governs the full lifecycle. Each stage below carries the component that owns it and the screenshot that shows it.
The iCollector gathers telemetry from every client environment and every add-on, structured, semi-structured, and unstructured alike, and normalizes it into one context-aware data model, with AI-assisted parsing for new and evolving sources.
SHOT 10The iCollector source list with normalization status and parser confidence per feed
The TDIR engine applies AI and machine-learning detection together with LLM-assisted correlation across the normalized picture, resolving scattered events from many sources into single incidents contextualized against MITRE ATT&CK.
SHOT 11The ATT&CK coverage view with detection content mapped by technique and tuning recency
TDIR and the AI-SecOps Autonomous Analyst drive automated triage, enrichment and evidence gathering, and a visual investigation graph accelerates root-cause analysis in place of manual pivoting between tools.
SHOT 12The visual investigation graph with four sources resolving to one entity
SOAR playbooks and agentic response execute through integrated response controls, native and third-party alike, as instructions issued by the engine under tiered human oversight with a full audit trail.
SHOT 13A playbook mid-execution, with the approval gate and the actions already taken
Outcomes reach the people who need them: analysts in one operator console, clients through a branded portal, and executives through board-level summaries generated from platform data.
SHOT 14The branded client portal as an end customer sees it
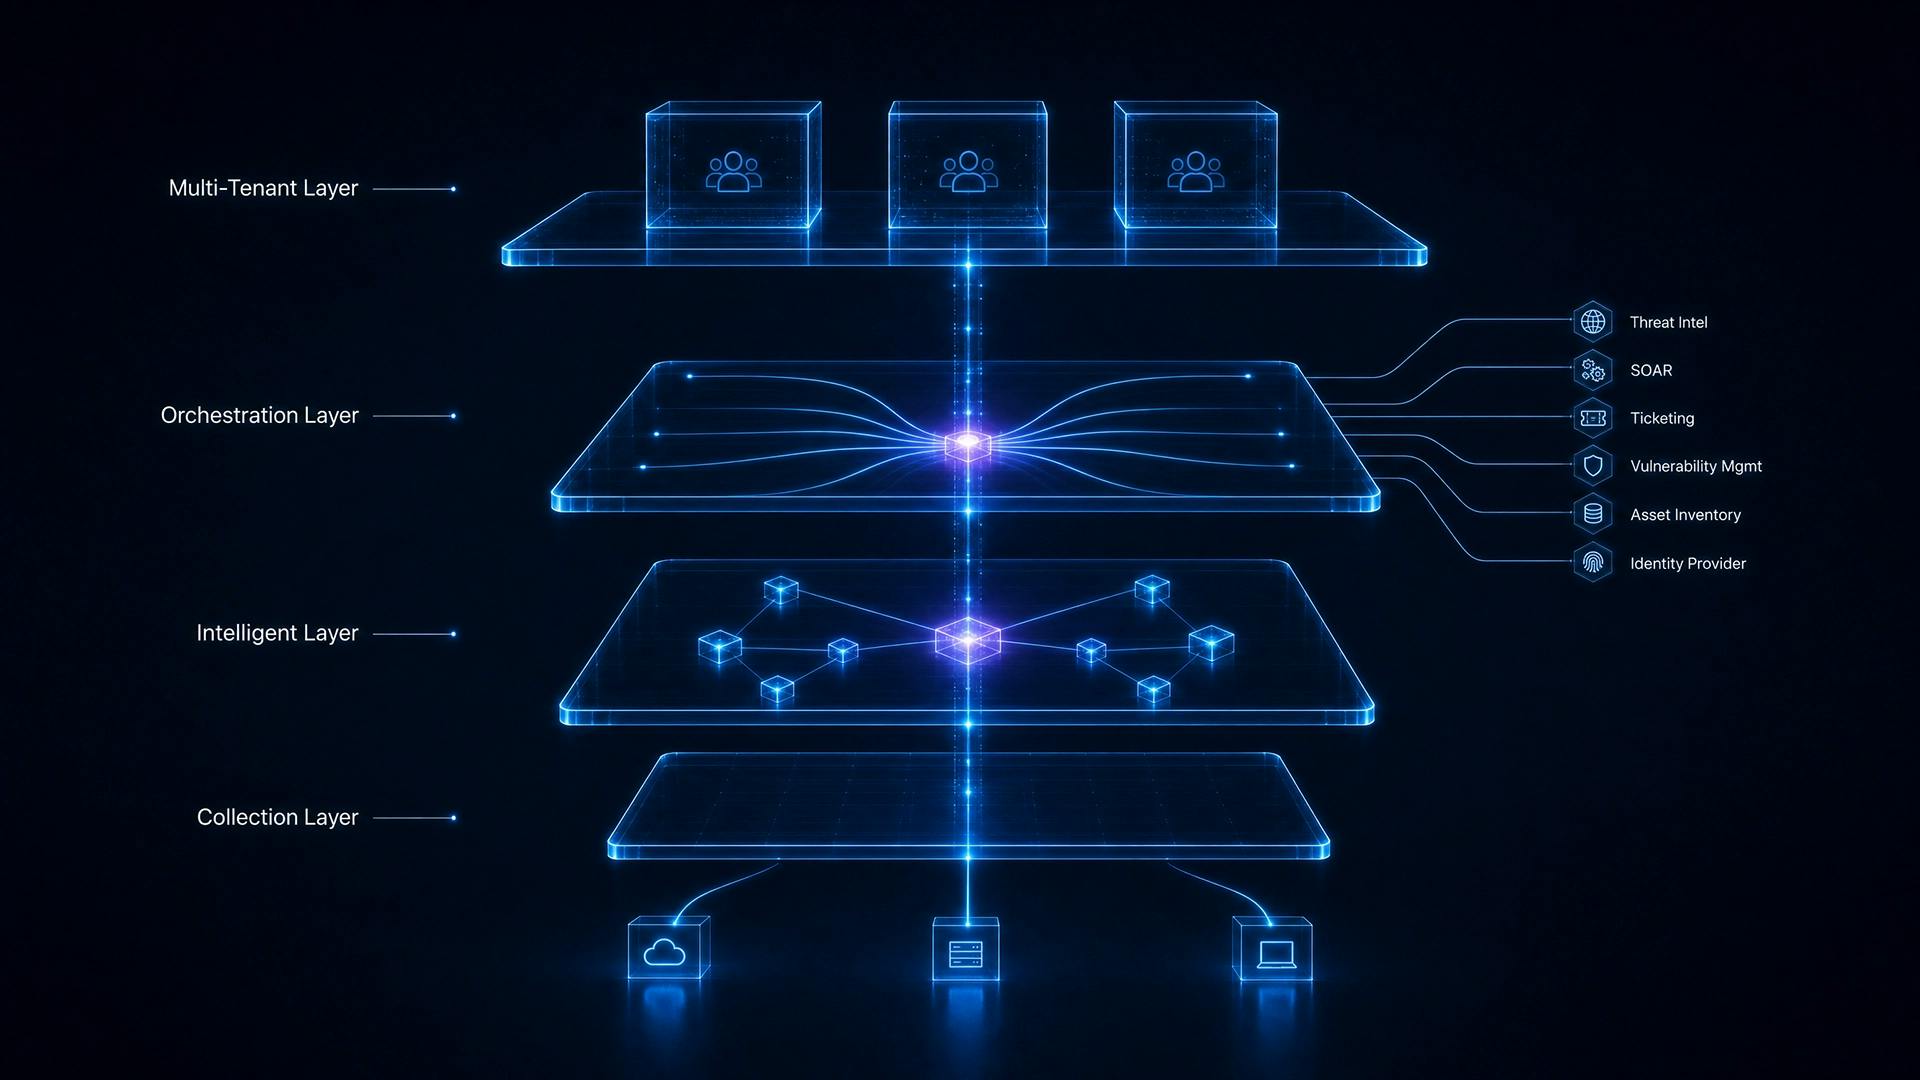
Detection quality, mean time to detect, mean time to respond and SLA attainment are tracked in one place, per tenant and across the book, against definitions the platform publishes.
SHOT 08 · ASSET EXISTSThe SLA and services dashboard at /assets/figma/sla-dashboard.png
Every outcome feeds back into the next cycle. Detection tuning, routing thresholds and playbook selection are adjusted on measured results rather than on assumption, which is what makes this a lifecycle rather than a pipeline
ClearSkies iISOC is multi-tiered and multi-tenant by design, and those tiers are the layers named in the component structure. Telemetry flows up from every client environment, and each layer depends on the one below it having done its work first.
iCollector
Gathers telemetry from every client environment and add-on and normalizes it into the shared context-aware data model, preparing the signal every layer above it depends on.
Centric-AI Fabric
Enriches normalized telemetry, resolves it to shared entities — user, host, identity, domain, asset and session — and provides the shared intelligence every other component draws on
TDIR
Applies AI and machine-learning detection with LLM-assisted correlation, resolves related events into single incidents contextualized against MITRE ATT&CK, and drives investigation and response alongside the native add-ons.
Delivers the result to one enterprise or to many tenants under strict isolation, converting outcomes into dashboards, auditable evidence and SLA-tracked service through one operator console and a branded client portal.
The value of a signal is not the alert it raises but the entity it resolves to. Normalization happens at collection and entity resolution happens immediately above it, which is why correlation in the layer above is possible at all rather than retrofitted through a translation step.
Governed autonomy
Every AI-assisted verdict reveals the evidence, reasoning and authorization behind it—so your team can move faster without losing visibility or control.
Incident
Illustrative demonstration
Contributing factors
A score an analyst can decompose into its contributing factors, rather than a number returned without provenance.
Investigation steps
Investigation steps taken by the AI-SecOps Autonomous Analyst are recorded as evidence, so a conclusion can be reviewed against the material that produced it.
Decision gate
Low-risk containment executes automatically, higher-impact action requires human authorization, and the threshold is configurable per tenant.
Decision record
Every automated and agentic action is logged with actor, input, decision and outcome, producing the record required for internal audit and regulatory review.
Because autonomy is only valuable when it remains accountable.
Designed to support organisational governance and evidence requirements across regulated environments.
Data Sovereignty governs where tenant data is held and processed, so residency and sovereignty requirements are met by configuration rather than by exception. Residency is confirmed per deployment at scoping.
Governance is designed against EU AI Act obligations alongside NIS2, DORA, GDPR and ISO/IEC 27001, and the platform produces the evidence your own compliance and audit processes draw on; it does not attest on your behalf.
The chain below is illustrative rather than drawn from a specific engagement. Each row states what a single-layer product would record in isolation and what the platform resolves from the same telemetry.
What each layer records alone
Attack Surface Monitoring detects a newly registered look-alike domain matching the client brand. Severity: informational.
What the platform resolves
The domain is registered as an entity and linked to the client brand before any user has contacted it.
What each layer records alone
DNS Shield logs three resolution attempts to that domain from two internal hosts. Severity: low.
What the platform resolves
Resolution attempts join the existing domain entity, converting an informational finding into evidence of active contact and identifying the two hosts involved.
What each layer records alone
Identity Threat Protection records a successful authentication for a finance user from an unfamiliar location, followed by registration of a new MFA method. Severity: medium.
What the platform resolves
The identity joins the same two hosts and the same domain, producing a sequence mapped to ATT&CK phishing and valid-accounts techniques rather than an isolated travel anomaly.
What each layer records alone
Endpoint Threat Monitoring and Response records a signed binary spawning a scripting host on one of those endpoints. Severity: medium.
What the platform resolves
Endpoint behavior lands on the same timeline as the identity event. Confidence rises from correlation across four sources rather than from the sensitivity of any single detection.
What each layer records alone
Four alerts, four consoles, four severity scales. None escalated. No owner. No incident.
What the platform resolves
One incident, one explainable risk score, one owner. The AI-SecOps Autonomous Analyst assembles the evidence, and orchestrated response disables the session, isolates both endpoints, blocks resolution at the DNS layer, and adds the domain to the tenant watchlist.
One system collects, correlates, decides, acts, and measures.
We use cookies and process personal data for the following purposes: Functional, Analytics & Marketing. See the full list of cookies or read our privacy policy.
Please choose the services and third-party applications we may use. See the full list of cookies or read our privacy policy.